Infographic: deputy and bystander’s vehicles collide
August 01, 2006
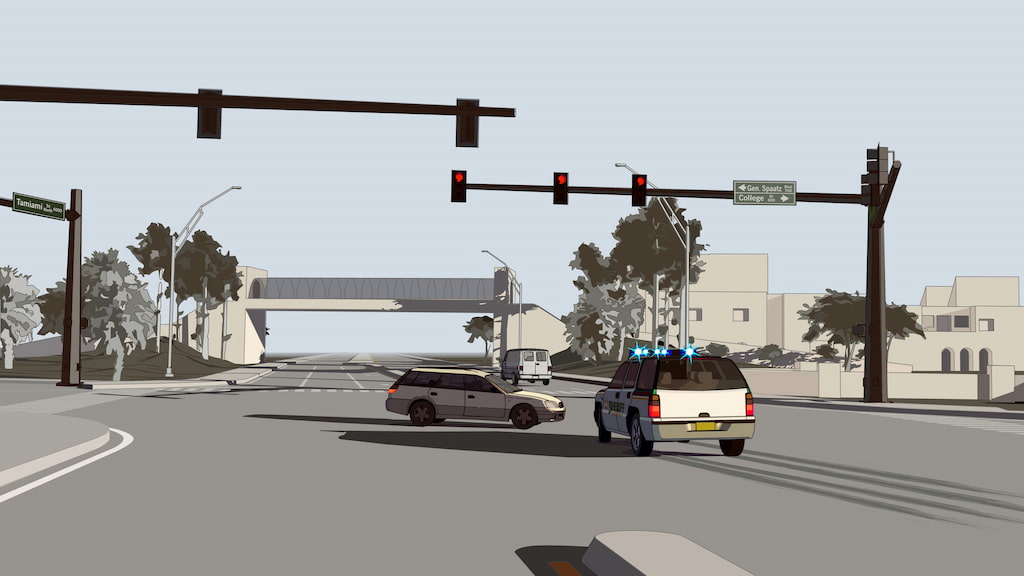
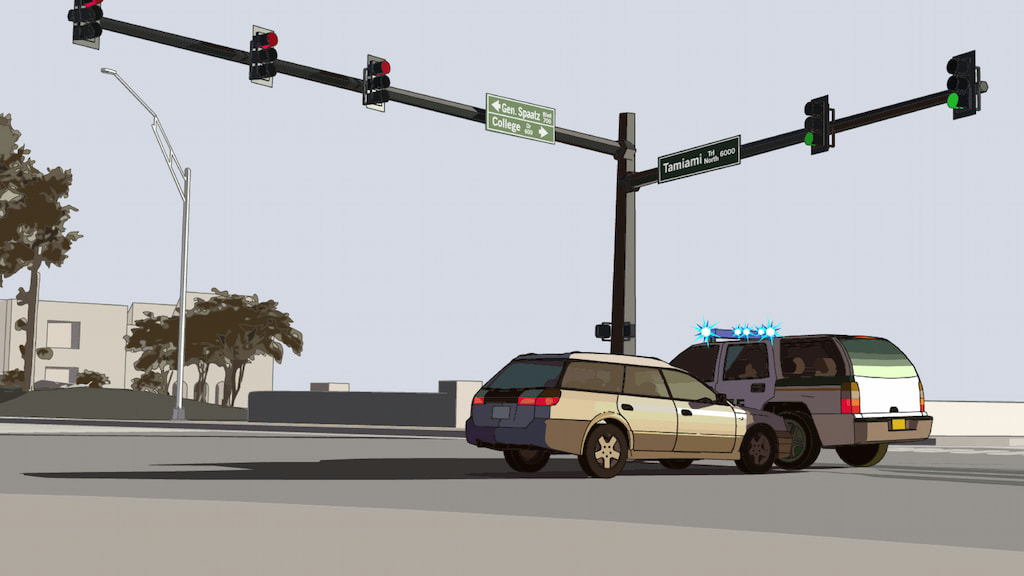
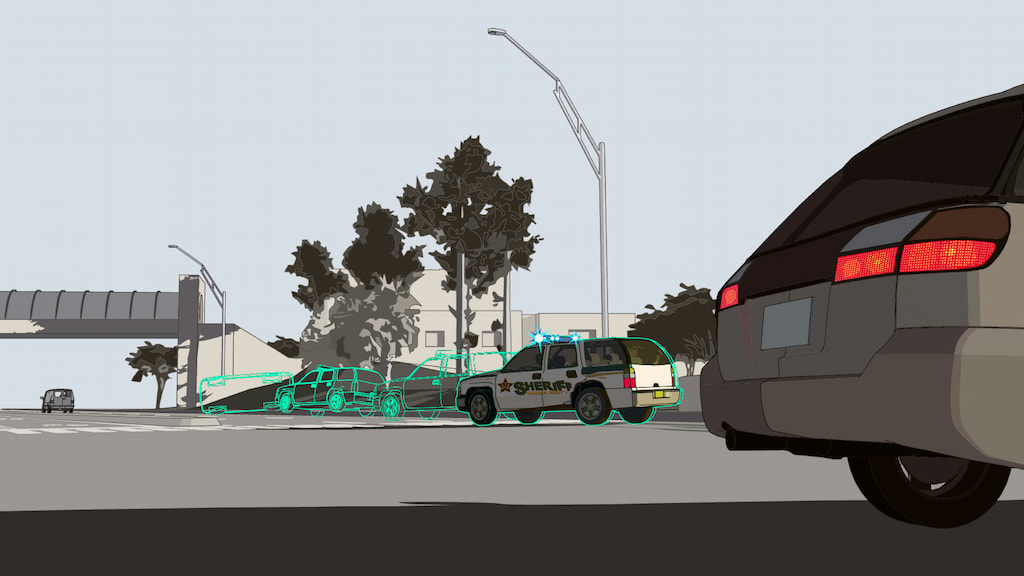
This infographic for the Sarasota Herald-Tribune, depicting a bystander’s crash with a deputy during a high-speed chase, involved a multi-faceted approach, incorporating research, sketching, 3D modeling, rendering vector graphics in Adobe Illustrator, and later integrating HTML, CSS, and SVG markup for an online presentation. A college professor returning to his lab after dinner finds himself in the middle of a high-speed police chase, which leaves his car totaled and a patrol vehicle overturned. 1At 7:22 p.m., Professor Leo Demski got the green light to cross U.S. 41. He was heading west, returning to his lab at New College of Florida. As he entered the intersection, he found himself in the middle of a high-speed police chase. 2Sheriff’s deputy Joseph Petta was chasing a stolen van heading south on U.S. 41. His vehicle’s emergency lights flashed, and its siren wailed. He had a red light as he entered the same intersection where Demski was crossing. 3Demski’s Subaru collided with Petta’s SUV. He was moving at about 10 miles per hour. 4Tire marks from the SUV indicated that Petta’s speed was approximately 60 miles per hour before impact. 5After the collision, the SUV continued to skid, leaving an additional 120 feet of tire marks on the road. It hit a curb, overturned, and smacked into a tree and a light pole. 6The stolen van that Petta was pursuing continued south on U.S. 41. It eventually stopped about a mile away, and its driver, Ronald Pendergrass, was arrested by deputies.Deputy and Bystander’s Vehicles Collide
About the Process
Research. Police reports, and statistical data became my primary sources, guiding the visual narrative I aimed to convey.
Sketching. Armed with the research, I started sketching, which allowed me to map out the visual storytelling elements, ensuring a coherent and engaging sequence.
3D Modeling & Rendering. To bring a sense of realism and depth to the infographic, I turned to 3D modeling, creating accurate representations of vehicles, the intersection, and the shadows cast on the scene according to the time of day and weather report.
Vector Graphics. Transitioning from 3D modeling to vector graphics in Adobe Illustrator allowed me to refine and enhance the visual elements. This step ensured the scalability of the design while maintaining crispness and clarity.
HTML, CSS, and SVG Markup: Interactive and Accessible Design. For this portfolio, I elevated the project beyond the static state intended for newspaper printing to a responsive web graphic.